COMING FALL 2026 THE FUTURE OF PET WASTE STATIONS Now Accepting Pre-Order and Distributor Inquiries


Why the Lowest Purchase Price Is Not Always the Lowest Cost
By Avi Kosch
Founder, PooStation by NEXGEN DNA
The bids had been gathered, the specifications had been compared, and the prices were arranged neatly from lowest to highest. Around the table sat the people responsible for protecting the community’s budget: board members, a property manager, a maintenance supervisor, and a representative from the management company. The purchase itself was ordinary. It might have involved air-conditioning equipment, parking-lot lighting, appliances for several rental units, flooring for a clubhouse, or equipment for the community grounds.
Someone pointed to the least expensive proposal and asked the question that purchasing committees have asked for generations.
“Why would we spend more?”
It was a reasonable question. Communities do not have unlimited resources. Municipalities answer to taxpayers, association boards answer to homeowners, and property managers are judged by their ability to control expenses without allowing service or appearance to decline. When two products appear to perform the same basic function, selecting the lower price can feel not only practical but responsible.
Yet experienced facilities professionals have learned to ask another question before voting.
“What will each option cost us after we buy it?”
That second question is more difficult because the answer does not fit neatly into a single column. It requires the purchaser to look beyond the invoice and consider the electricity an asset will consume, the supplies it will require, the hours employees will spend maintaining it, the repairs it may need, the interruptions it may create, and how soon it will have to be replaced. The first price is visible before the purchase. The second reveals itself slowly, often across several budgets and under the supervision of people who were never present when the original decision was made.
Commercial heating and cooling systems provide one of the clearest examples. When a building needs a new HVAC system, the equipment and installation costs can dominate the conversation. Those numbers are immediate, substantial, and easy to compare. Yet FacilitiesNet has reported that, over the life of a typical commercial or institutional HVAC system, purchase and installation may account for only about 10 percent of total ownership cost. The other 90 percent can arise through energy consumption, operation, and maintenance.
That changes the meaning of “less expensive.”
A system that saves money during construction but uses more electricity, requires harder-to-find components, creates difficult service access, or demands more frequent attention may continue collecting the difference long after the initial savings have been celebrated. Even a system with excellent efficiency ratings can become costly when its design makes maintenance unnecessarily complicated. A filter that is difficult to reach, a component that requires extensive disassembly, or equipment installed without adequate service clearances can turn ordinary preventive maintenance into a recurring labor expense.
This is why experienced facility managers seek involvement before the equipment is selected, not merely after it is installed. They understand that the design team sees the project cost, while the operations team will live with the operating cost. The people approving the purchase may focus on the next fiscal year. The people maintaining it must think about the next decade.
The same lesson transformed commercial lighting.
When LED fixtures first became a serious alternative to conventional lighting, many purchasers saw primarily the higher price of the fixture. The technology could promise lower electricity use and a longer operating life, but the savings were less visible than the immediate premium. A conventional lamp cost less today. The LED might save money later. For organizations working within strict capital budgets, “later” was not always persuasive.
Lifecycle calculations made the comparison harder to ignore. In a simple example published by the U.S. Department of Energy, a fluorescent bulb with an initial cost of $5 accumulated approximately $50 in lifetime energy costs, producing a total of $55. An LED providing comparable light cost $10 initially but used approximately $20 in energy, producing a total lifetime cost of $30. The product that cost twice as much at the beginning cost substantially less to own, even before accounting for the additional replacements that the shorter-lived fluorescent bulb might require.
In commercial applications, the scale becomes far more consequential. The Department of Energy calculated that a representative efficient commercial LED luminaire could justify an upfront price as much as $135 higher than a less-efficient model because its projected lifetime energy cost was $146 instead of $281. The best available model in that comparison reduced the projected energy cost further, to $119.
Those figures concern a single fixture. Commercial properties may operate hundreds or thousands of them.
MGM Resorts International replaced more than 4,400 metal-halide and high-pressure-sodium fixtures in parking facilities across its portfolio. The resulting lighting and control upgrades saved approximately 4.5 million kilowatt-hours annually. Across the broader Department of Energy parking-lighting program, participating organizations upgraded or installed lighting across 1.7 million parking spaces and reported approximately $24.2 million in annual electricity savings.
The lesson was not that every property should automatically purchase the most expensive fixture. It was that fixture price alone was an incomplete measure of cost. Electricity mattered. Service life mattered. Relamping labor mattered. The cost of lifts, ladders, traffic control, employee time, and disruptions mattered. A lamp mounted high above a parking structure does not cost only what was printed on its carton. It also costs whatever the property must spend each time someone has to reach it.
Flooring tells a quieter version of the same story. A property manager may compare products by price per square foot, yet that figure says little about how the material will perform under actual traffic or what will be required to preserve its appearance. The real cost includes floor preparation, installation, routine cleaning, periodic restoration, chemicals, machinery, labor, disruption, and eventual replacement. Facilities professionals therefore evaluate not only what a floor costs to install but whether it is appropriate for the space and how much maintenance it will demand after occupants begin walking on it.
A surface that looks economical in a bid package can become expensive when it requires repeated stripping, refinishing, deep cleaning, or premature replacement. Conversely, a material with a higher initial cost may preserve its appearance with less intervention and remain in service longer. The financial difference is rarely dramatic on installation day. It emerges one cleaning cycle, one damaged section, and one replacement schedule at a time.
Property managers encounter a similar calculation with appliances. The least expensive refrigerator may satisfy the basic specification, but multifamily operators also have to consider reliability, parts availability, service coverage, replacement lead times, and the effect of appliance failure on tenant satisfaction and unit turns. GE Appliances
markets its property-management program around those operational realities, emphasizing durability, reduced downtime, faster issue resolution, and keeping apartments rental-ready. Its selection guidance explicitly includes total cost of ownership rather than appliance price alone.
A refrigerator that saves $75 but delays a unit turn, requires two service visits, or causes food-loss complaints may not have saved the property anything. A dishwasher failure that creates water damage is no longer merely an appliance problem. The second price tag can include maintenance coordination, resident communication, flooring repairs, cabinetry damage, and lost staff time.
These examples are different in size and complexity, but they share the same pattern. The first price belongs to procurement. The second belongs to operations.
Facility professionals have a formal term for this way of thinking: Total Cost of Ownership. APPA describes it as a holistic approach to asset management and resource allocation that brings together initial, recurring, renewal, replacement, and end-of-useful-life costs. The purpose is not to make every purchase more expensive. It is to help organizations use limited resources more effectively by comparing what alternatives are likely to cost over time rather than comparing only what they cost to acquire.
Total Cost of Ownership is sometimes dismissed as a concept reserved for major buildings, mechanical systems, or multimillion-dollar capital projects. In reality, it may be even more revealing when applied to the smaller assets repeated throughout a property. A single waste receptacle, light fixture, appliance, bench, irrigation component, or pet waste station may not materially affect a budget. Multiply it by 25 locations, 50 properties, or ten years of recurring service, and the economics change.
Pet waste infrastructure offers a particularly useful example because it contains both a one-time cost and several continuing costs that are easy to overlook.
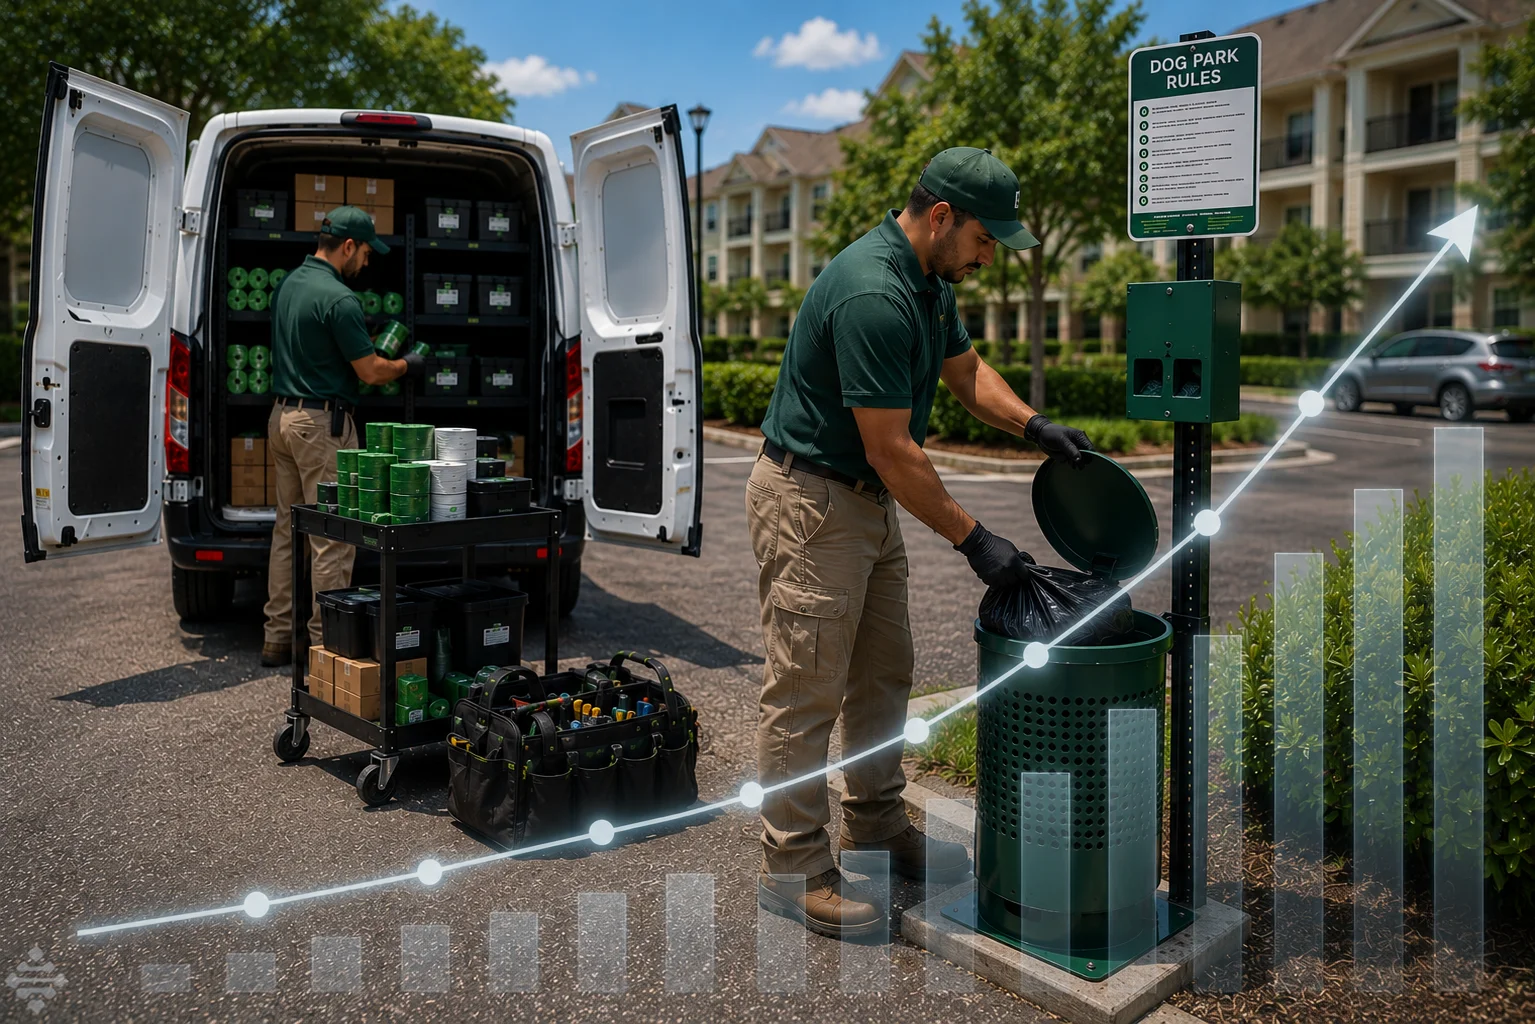
The station is purchased once. Bags are purchased repeatedly. Liners are purchased repeatedly. Employees inspect the station, replenish supplies, empty the receptacle, clean the surrounding area, and respond when something goes wrong. The financial life of the product does not end when it is installed. In many respects, that is when it begins.
A municipality in Western Australia recently confronted the scale of that continuing obligation. The City of Wanneroo reported that residents were using approximately three million dog-waste bags annually. Its council approved a major expansion that would extend bag dispensers and bins from 81 parks to 486 parks over five years. The initiative involved not only the purchase and installation of more than 500 new dispensers and bins but also additional staffing and operational resources to support them.
Three million bags transform a seemingly minor supply item into a serious budget category.
For one community, a difference of a few dollars per roll may not initially attract attention. Across a municipal park system, a large apartment portfolio, or a management company serving dozens of properties, that difference compounds with every case ordered. The unit mounted on the property remains visible for years. The cartons arriving at the maintenance facility are less visible, even though their cumulative cost may eventually exceed the equipment purchase.
This is where pet waste stations reveal the same economic tension seen in HVAC, lighting, flooring, and appliances. Buyers can spend most of their time negotiating the capital cost while giving comparatively little attention to the operating system that follows. How many bags does the dispenser hold? How often must it be refilled? How much does each replacement roll cost? How many rolls must be purchased to obtain the advertised price? How large is the receptacle? How frequently will it need collection? What do the liners cost? How easily can employees service the equipment? How well will the hardware and finish withstand weather, irrigation, humidity, salt air, and daily use?
None of those questions suggests that inspections should be reduced. A high-capacity station still requires routine attention. A larger waste container still needs to be emptied before odor, appearance, or sanitation becomes a problem. Capacity should not replace maintenance. It should create operational resilience between scheduled visits.
That distinction becomes especially important during holiday weekends, community events, staffing shortages, and unexpectedly heavy use. A dispenser with limited capacity may work adequately under average conditions but run empty when demand rises. A smaller receptacle may remain manageable during the week but overflow before staff returns on Monday. When that happens, the cost is no longer limited to a refill or collection. Employees may need to make an unscheduled trip, clean the surrounding area, address resident complaints, or restore a station that has become unpleasant enough to discourage proper use.
There is also a common trap in commercial pricing: the lowest advertised supply price may be available only at quantities that most communities will never purchase. A price tied to 100 or more cases is not necessarily the relevant price for an HOA, an apartment community, or even a modest municipal department. The meaningful comparison is the price the actual customer can obtain at the quantity the customer can realistically store and use. An internal review of current market pricing conducted by NEXGEN DNA illustrates the issue. Several established suppliers offer highly competitive per-roll bag prices, but some reserve their lowest tiers for purchases exceeding 100 cases, and in certain listings for quantities far beyond what an individual property would ordinarily order. PooStation’s pricing reaches its lowest current bag tier at 25 cases, placing it near the lowest prices identified in that market review without requiring distributor-scale purchasing.
That does not mean one price comparison can establish the full value of a system. Bag thickness, dimensions, materials, case configuration, compatibility, shipping, contractual terms, and actual performance also matter. Nor does it mean every customer should purchase 25 cases. The editorial point is more fundamental: recurring supplies must be evaluated at realistic purchasing quantities, because an attractive price that a customer cannot practically access is not the customer’s true operating cost.
PooStation also offers a useful example of how the initial and continuing costs can be considered together. Introduced by NEXGEN DNA, the unit is priced competitively within the commercial station market, with volume pricing reaching $375 per station for qualifying orders. Its design includes a 1,200-bag dispensing capacity, a 20-gallon waste receptacle, sanitary hand and foot operation, and an integrated LED safety light. Its bag pricing, meanwhile, is structured to become highly competitive at commercially attainable quantities.
Naming the product in an editorial does not require pretending it is the answer for every property. It simply demonstrates that the market need not force communities into a false choice between higher functionality and responsible pricing. A purchaser can ask for larger capacity, greater accessibility, improved sanitation, practical supply costs, and competitive equipment pricing at the same time. The proper comparison is not whether one station costs more or less in isolation. It is what the complete system asks the community to spend and do over its service life.
A less expensive station may be the better purchase when it is durable, easy to service, compatible with reasonably priced supplies, and appropriate for the site. A more expensive station may be the poorer purchase when its features add little operational value or its proprietary consumables carry excessive recurring costs. Total Cost of Ownership is not a justification for buying the premium option. It is a discipline for identifying which option is actually economical.
That discipline also requires humility. No spreadsheet can predict every repair, weather event, labor increase, product failure, or change in resident behavior. Lifecycle analysis is not valuable because it eliminates uncertainty. It is valuable because it prevents the purchase price from masquerading as the whole truth.
The board member pointing to the lowest bid is not wrong to care about cost. The maintenance supervisor asking what happens afterward is not asking the community to spend recklessly. Both are trying to protect the same budget. They are simply looking at different moments in the life of the purchase.
The strongest decisions bring those moments together.
They consider what the equipment costs when it arrives and what it will cost each time it is powered, cleaned, filled, emptied, repaired, inspected, or replaced. They account for the consumables stored in the maintenance room, the employee dispatched across the property, the service call that interrupts another task, and the resident who notices only when the system fails.
Years later, few residents will know what the community paid for its air-conditioning equipment, parking lights, flooring, appliances, or pet waste stations. They will know whether their homes remain comfortable, whether the walkways are safely lit, whether the clubhouse looks maintained, whether appliances work, and whether bags are available when they need them.
That is the quiet purpose of better purchasing. It is not to acquire the product with the most features or the highest price. It is to choose the asset that performs its role consistently while making the most responsible use of money, labor, and time.
The purchase order records the first price.
The property pays the second.
And in many cases, the second price is the one that determines whether the original decision was truly a bargain.
References
APPA. APPA 1000-1: Total Cost of Ownership—Key Principles.
APPA. APPA 1000-2: Total Cost of Ownership—Implementation and Data Elements.
APPA. “An Introduction to Total Cost of Ownership.” Facilities Manager.
FacilitiesNet. “How to Plan HVAC Systems for Long-Term Performance.”
FacilitiesNet. “What Is the Real Cost of Flooring?”
FacilitiesNet. “How to Consider Flooring Maintenance Costs.”
U.S. Department of Energy, Federal Energy Management Program. “Take Five: Life Cycle Costs for Acquisition.”
U.S. Department of Energy, Federal Energy Management Program. “Purchasing Energy-Efficient Commercial and Industrial LED Luminaires.”
U.S. Department of Energy, Better Buildings Initiative. “MGM Resorts: Casino Parking Structure Lighting.”
U.S. Department of Energy, Better Buildings Initiative. “LEEP Recognition Case Studies.”
GE Appliances. “Appliances for Property Managers.”
City of Wanneroo. Public reporting concerning the expansion of municipal dog-waste bag dispensers and bins, 2025.